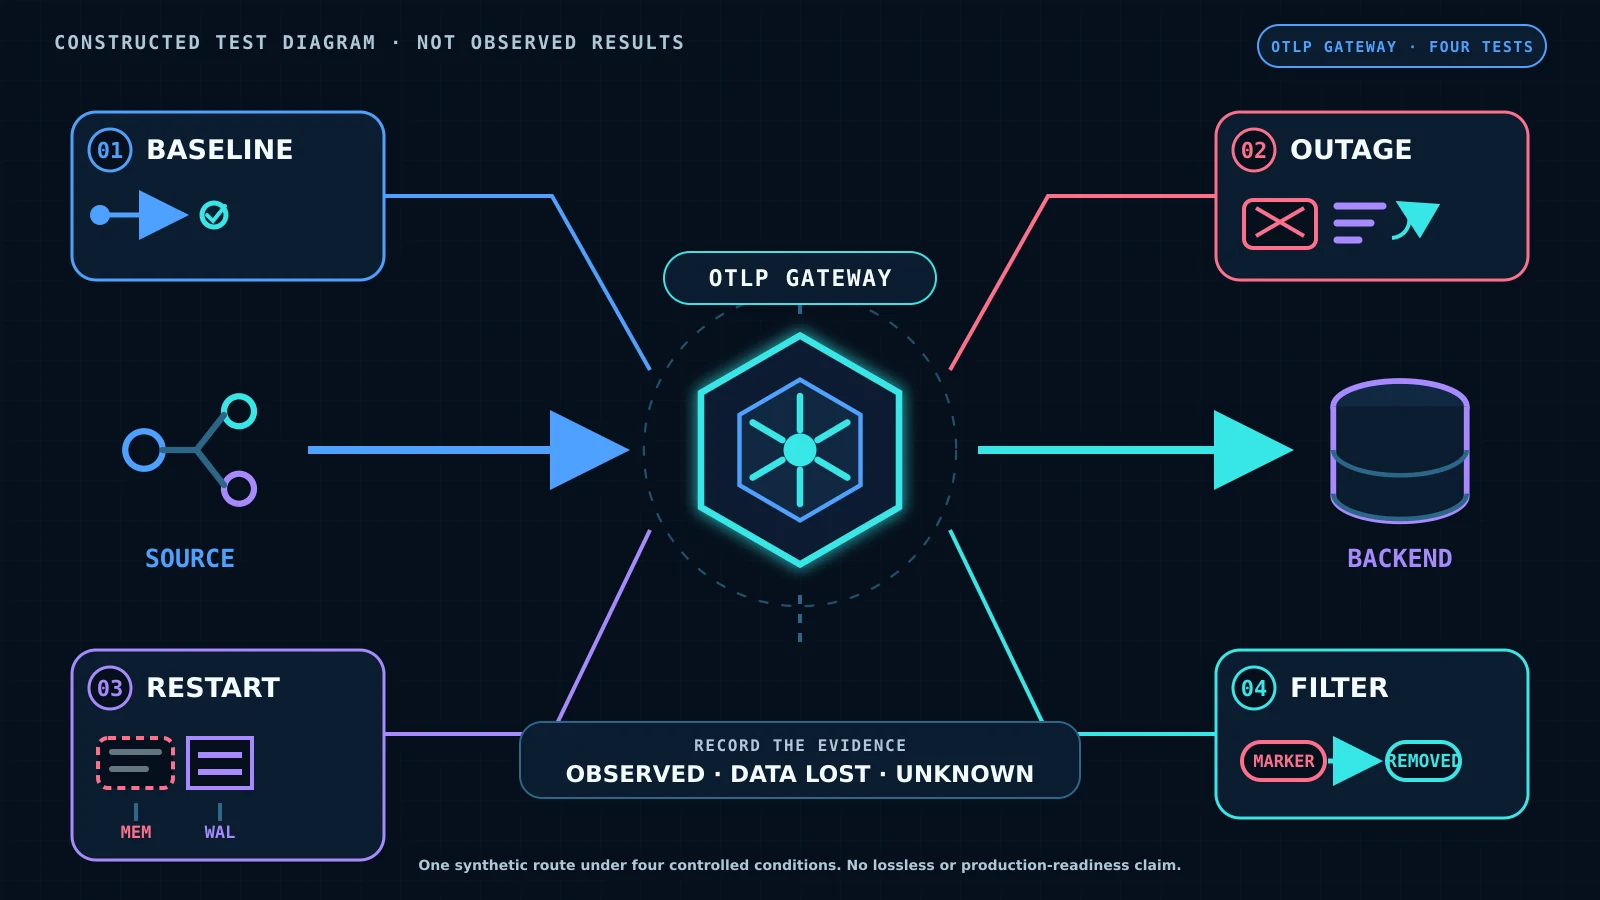


One agent trace reaching a backend proves that one request worked once. It does not show what happens when the backend is unavailable, the gateway restarts with data waiting, or a trace contains an attribute that should never cross the boundary.
Before a team calls a cross-cloud telemetry path production-ready, run one synthetic trace through the exact route it intends to operate. Give the trace a unique test ID, make every interruption deliberate, and record unknown when the evidence cannot show whether data arrived or disappeared. This tutorial produces four evidence rows: baseline delivery, backend outage, Collector restart, and attribute filtering.
The test is small by design. It does not measure production throughput or certify the path as reliable, private, or compliant. Its job is to expose an untested queue, restart, or filtering assumption before real agent traces depend on it.
Start with the path you intend to operate
OpenTelemetry Protocol, or OTLP, is the protocol used to move traces, metrics, and logs between telemetry components. The OpenTelemetry Collector is a service that can receive, process, and export those signals. In the gateway deployment pattern, applications or local Collectors send OTLP data to one central endpoint provided by one or more gateway Collectors. The gateway then sends the data to one or more selected backends.
For this test, the path is:
source agent or local Collector → central OTLP gateway → test backend
Use the intended network boundary, authentication method, gateway build, processing pipeline, and backend exporter. A developer laptop sending directly to a local viewer does not test a gateway that will later sit between a data center and a cloud backend.
The OpenTelemetry gateway documentation describes central credential and policy management as advantages of this pattern. It also lists the trade-offs: another service to maintain, another failure point, added latency in cascaded deployments, and higher resource use. If processing such as tail sampling needs all spans for one trace in the same Collector, routing may also need to be trace-ID-aware. A load balancer that distributes spans without that requirement in mind can make a complete trace look incomplete.
If the destination is AWS and the source runs outside AWS, IAM Roles Anywhere is one possible authentication design. It lets an external workload use X.509 trust to obtain temporary AWS credentials instead of managing long-term credentials. That choice is optional and AWS-specific. The test still needs to record the actual identity and network path in use.
Define the evidence before sending the baseline
Create a unique, non-sensitive value such as otel-gateway-test-2026-08-16-01. Put it in a dedicated attribute such as gateway.test_id on every span in one synthetic trace. Do not reuse a customer, ticket, account, prompt, or session identifier.
Make the trace structure easy to inspect. For example, emit one parent span and two child spans with known names. Record the expected span count and parent-child relationships before the run. Trace completeness then has a concrete meaning: the backend must contain the expected spans under the same trace ID with the expected relationships, not merely display one searchable event.
Also add a harmless marker attribute for the later filtering test. Use a secret-shaped string that is deliberately fake, such as gateway.marker=SECRET_SHAPED_TEST_VALUE_NOT_A_SECRET. Never put a real password, token, key, certificate, customer record, or production prompt into telemetry to test whether a filter works.
Before sending anything, copy these facts into the evidence record:
- test ID and expected trace structure;
- source environment and source timestamp in UTC;
- Collector distribution, exact build or version, and configuration revision;
- gateway endpoint and intended backend;
- authentication method without the credential value;
- configured sending-queue type and capacity;
- configured retry intervals and maximum retry window;
- persistent storage setting and storage location class, if used; and
- the reviewer who will compare gateway and backend evidence.
Do not copy queue and retry defaults from an article. Read the effective versioned configuration that the test instance is running. Defaults and component behavior can change across Collector distributions and releases.
Baseline: prove one complete synthetic trace arrives
Start with the gateway and test backend available. Send the synthetic trace once. Record the source send time, gateway acceptance evidence, backend arrival time, backend trace ID, received span count, and parent-child structure.
The baseline passes only when the unique test ID appears at the intended backend and the received trace matches the structure defined before the run. If the gateway reports acceptance but the backend cannot find the trace, the result is not a pass. If the backend shows two of three expected spans, the result is incomplete. If either side lacks evidence that can be tied to the test ID, record unknown rather than inferring delivery from a green service dashboard.
This row establishes the control case for the three failure tests. Preserve it with the exact configuration revision so later results are not compared with a different pipeline.
Failure test A: make the backend unavailable
A sending queue holds telemetry while an exporter tries to deliver it. A retry policy tells the exporter when to try again and when to stop. OpenTelemetry's Collector resiliency documentation explains that these controls can reduce loss during an endpoint outage. It also identifies the boundaries: a queue can fill, a retry window can expire, and data can be dropped.
Make only the test backend unavailable. Stop its test instance or deny the gateway-to-backend route with a reversible test control. Do not block the source-to-gateway path, because that would test a different failure.
While the backend is unavailable:
- Send a new synthetic trace with a new test ID.
- Record whether the gateway accepted it.
- Observe
otelcol_exporter_queue_sizeandotelcol_exporter_queue_capacity, or the documented equivalents for the exact build. - Record exporter failure or retry evidence tied to the outage window.
- Keep the interruption shorter than the configured retry limit for the first run.
Restore the backend and wait only within the stated test window. Then search for the test ID and inspect trace completeness. Record the highest observed queue use, the configured capacity, when retries began, when the backend recovered, and when the trace arrived.
A pass means the trace arrived complete after recovery within the configured boundary. A failure means the evidence shows it was dropped or arrived incomplete. If the backend lacks the trace but the gateway evidence cannot distinguish an expired retry, queue overflow, filter drop, or search delay, record unknown and investigate. A queue returning to zero does not by itself prove delivery; data may have been exported, rejected, or dropped.
Repeat with an outage long enough to approach the locally approved limit only if the test environment can absorb the expected drop behavior. The goal is to learn the configured boundary, not to claim that retries make the path lossless.
Failure test B: restart the Collector with data waiting
An in-memory queue can hold data during a backend outage, but memory disappears when the Collector process stops. Test that failure directly.
With the backend unavailable, send a new synthetic trace and wait until queue evidence shows data pending. Record the test ID and queue state. Restart the gateway Collector, restore the backend, and look for the trace.
For an in-memory queue, a missing trace after restart is expected evidence of the risk documented by OpenTelemetry. Do not turn that result into a percentage or a universal claim about all queued data. It shows what happened to this trace under this build, configuration, and restart.
Now repeat the same sequence with persistent queue storage enabled in the versioned gateway configuration. Persistent storage writes queued data to a write-ahead log, or WAL, so the Collector can resume export attempts after a restart. Confirm that the configured directory is actually persistent for the test instance; a container path that disappears with the container does not exercise durable storage.
A persistent-queue pass requires more than a successful restart. Show that the test trace was waiting before the restart, that the Collector resumed the queued export afterward, and that the backend received the complete trace. Record storage errors and queue evidence during the sequence.
A WAL reduces one restart-loss mode. It is not a lossless guarantee. OpenTelemetry notes that disk failure, full disk, and an endpoint outage beyond the retry limits can still cause loss. Dedicated message queues can create a stronger boundary for some paths, but they add their own availability, retention, configuration, and operating responsibilities.
Failure test C: remove a harmless secret-shaped marker
The Collector can filter telemetry and add, delete, update, or replace attributes before export. OpenTelemetry's transformation documentation describes these processors as useful for governance, cost, security, and data quality. It also warns that advanced transformations can affect Collector performance.
Configure one explicit gateway rule to delete or replace gateway.marker. Keep gateway.test_id; the backend still needs a non-sensitive value for the receipt check. Validate the effective configuration using the documented method for the exact Collector distribution before starting the test.
Send a new synthetic trace whose marker value is SECRET_SHAPED_TEST_VALUE_NOT_A_SECRET. At the backend, find the trace by gateway.test_id and inspect every received span. The trace should arrive complete, while the raw marker value should be absent or replaced exactly as the rule specifies.
Record both conditions. A trace that disappears entirely does not prove redaction; the processor may have dropped the span or the path may have failed. A trace that arrives without the marker proves only that this rule handled this marker on this tested route. It does not prove that the gateway discovers every sensitive attribute, nested payload, event, resource field, log body, metric label, prompt, or tool argument.
Review the real sanitized schema separately. Use the AI workflow security review to document what the workflow may read, what providers and stores can see, what must be excluded, and who owns the stop decision. Filtering is one implementation control inside that wider boundary.

Keep the four results in one evidence record
Use one row per condition. Do not replace the record with a screenshot of the backend.
Scroll sideways to see all 5 columns.
| Condition | Expected evidence | Observed result | Lost or unknown | Reviewer |
|---|---|---|---|---|
| Baseline | Gateway accepts the test ID; backend receives the complete known trace. | Record timestamps, IDs, span count, and relationships. | Name every missing fact; use unknown when receipt cannot be proved. | Name and date. |
| Backend outage | Queue and retry evidence rises during the outage; complete trace arrives after recovery within configured limits. | Record queue size/capacity, retry window, recovery, and receipt. | Record dropped, incomplete, expired, overflowed, or unknown. | Name and date. |
| Collector restart | In-memory and persistent runs show their actual restart behavior; persistent run resumes queued export if the tested storage works. | Record pre-restart queue, restart, storage, resumed export, and receipt. | Record missing trace, storage error, retry expiry, or unknown. | Name and date. |
| Attribute filtering | Complete trace arrives; harmless raw marker does not. | Record rule revision, test ID, backend inspection, and replacement if used. | Record raw marker present, trace absent, partial trace, or unknown. | Name and date. |
Attach the exact Collector build and configuration revision to the record rather than pasting secrets or full production telemetry. Keep UTC timestamps for source send, gateway acceptance, queue change, restart, backend recovery, and backend receipt. If clocks are not synchronized, note that uncertainty instead of calculating a misleading latency.
Know what this test does not establish
Four passing rows show that one synthetic trace followed one tested route under four controlled conditions. They do not establish sustained throughput, latency under load, queue capacity during a real outage, every Collector replica, every backend, or every network route.
The test does not prove that the gateway filters every sensitive value. It does not replace a data inventory, threat model, credential review, retention decision, or access review. It does not show what happens when persistent storage fills or fails. It does not prove service-level objectives or exactly-once delivery.
Repeat the test whenever the effective path changes: Collector build, processor order, exporter, authentication, storage, load balancer, routing policy, backend, or network boundary. If tail sampling or another stateful processor depends on complete traces, include the production routing behavior rather than assuming the baseline covers it.
After transport behavior is recorded, use the agent observability cost estimator to keep volume, retention, evaluation, and vendor pricing in a separate source-dated comparison. Use the AI observability quality-lane guide to distinguish a healthy telemetry pipeline from evidence that the agent's output remains acceptable. Delivery evidence, cost evidence, and output-quality evidence answer different questions.
Run the test before the path gets production traces
Choose the exact intended source, gateway, identity, storage, and backend. Send a known synthetic trace. Interrupt only the backend, restart the Collector with data waiting, and test one harmless marker rule. For each row, record what arrived, what was lost, and what remains unknown.
If the team needs help designing the path or making the failure evidence reviewable, BaristaLabs can review one telemetry path. Bring a sanitized trace schema, the versioned Collector configuration, the intended backend, and the failure window. Do not send production traces or credentials.
Sources
- OpenTelemetry: Gateway deployment pattern, accessed August 16, 2026.
- OpenTelemetry: Collector resiliency, accessed August 16, 2026.
- OpenTelemetry: Transforming telemetry, accessed August 16, 2026.
- AWS IAM Roles Anywhere User Guide: What is IAM Roles Anywhere?, accessed August 16, 2026.
- BaristaLabs: AWS cross-cloud agent telemetry needs an architecture decision, published and accessed August 16, 2026.
Telemetry gateway failure test
Test one intended trace path before production
BaristaLabs can help your team define the synthetic trace, inject the outage and restart, verify filtering, and record what the gateway can and cannot prove.
Bring a sanitized trace schema, versioned Collector configuration, intended backend, and failure window. Do not send production traces or credentials.
Turn this idea into a pilot
Which workflow should go first?
Use the readiness check to compare impact, effort, risk, owner, and next step before requesting a review.
- 3-5 minutes
- Deterministic score
- No sensitive data
Practical AI Workflow Notes
Want more practical AI operations ideas?
Get short notes on applying AI inside real small-business workflows — from document handling and customer follow-up to internal reporting, compliance, and automation guardrails.