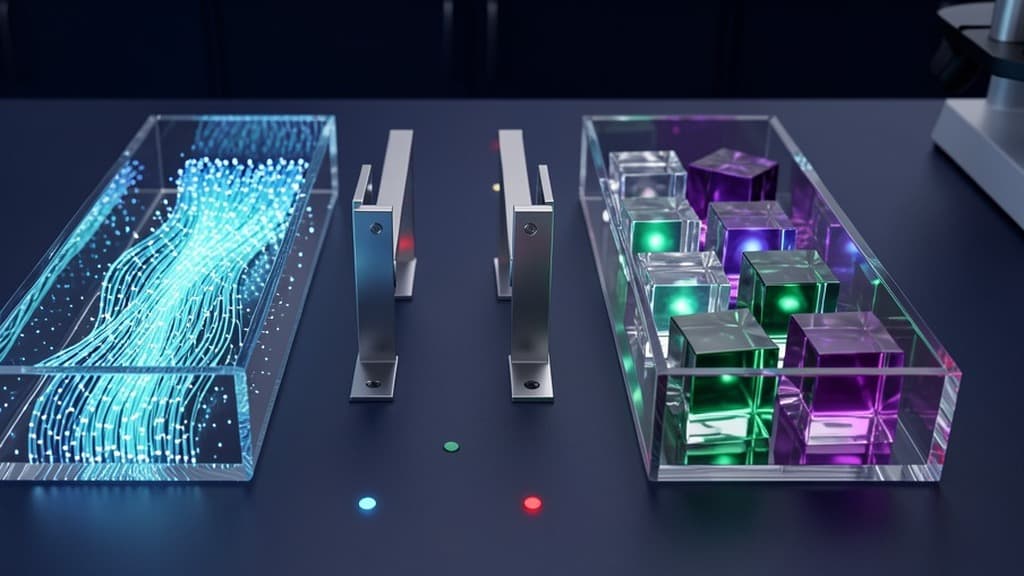

A support triage dashboard can look perfect at 9:07 a.m.
Latency is low. Error rates are flat. GPU memory is inside the line someone drew during launch week. Requests are flowing. Grafana is green.
Then a support lead opens the morning sample and finds the agent approving refunds outside policy. Or routing angry enterprise tickets to the wrong queue. Or summarizing cancellation threats as "general feedback" because the model has found a new, unhelpful shortcut.
Nothing crashed. That is the problem.
Ordinary API monitoring tells you whether the service is alive. Production AI monitoring also has to tell you whether the work is still acceptable.
AWS made that split explicit in its May 29 technical post on comprehensive observability for Amazon SageMaker AI LLM inference. The useful part is not the dashboard pattern by itself. It is the operating habit behind it: teams need to watch both model serving infrastructure, the "quantity" lane, and LLM quality, the lane that checks the responses themselves.
For teams moving AI workflows out of pilot mode, that split matters more than the specific stack.
The two lanes your AI dashboard needs
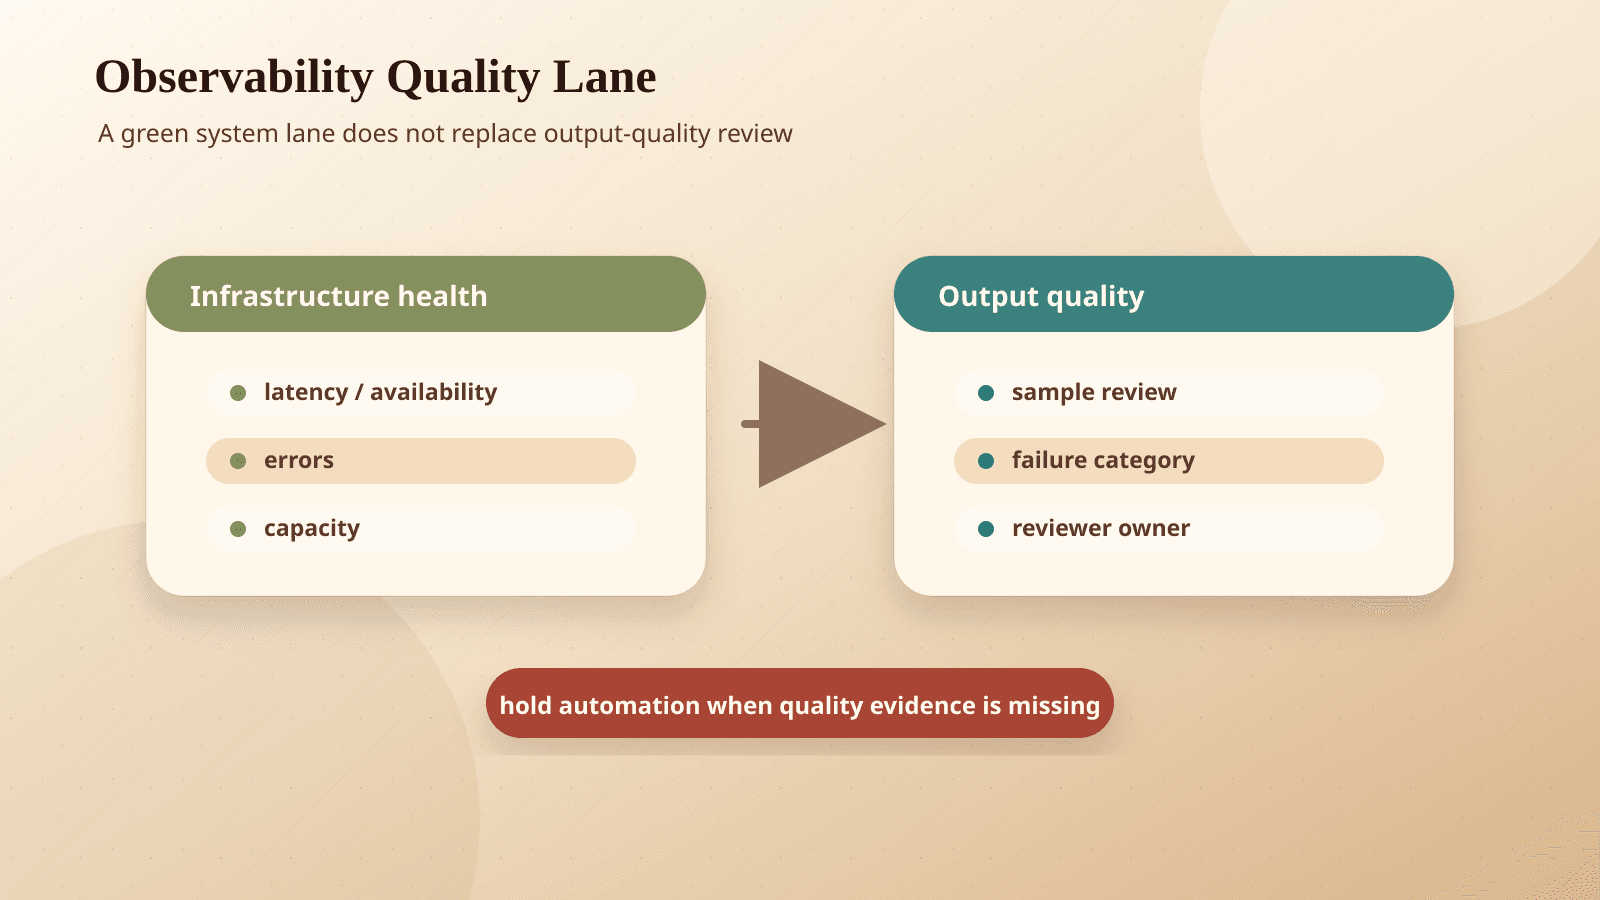
AWS describes LLM observability as two complementary dimensions.
The first lane is quantity. This is the familiar infrastructure view: request throughput, latency, errors, GPU utilization, memory pressure, and the other signals that show whether your inference endpoint is stable and cost-effective. These metrics help teams find bottlenecks, right-size compute, and control cost.
If you use SageMaker, AWS documents that endpoint metrics are published to Amazon CloudWatch, with endpoint metrics available at a 1-minute frequency by default. CloudWatch can also support historical visibility and alarms when a metric crosses a threshold.
The second lane is quality. This is where AI monitoring stops behaving like normal uptime monitoring. Quality monitoring evaluates the model responses themselves: accuracy, compliance, consistency over time, drift, degradation, and behavior that is unsafe or outside policy.
That quality lane might include sampled transcripts, evaluator scores, policy checks, human review results, tool call traces, source citations, or approval outcomes. It depends on the workflow. A customer support agent needs different checks than an invoice coding assistant or a sales research agent.
A dashboard that only shows the first lane is incomplete. It can tell you the endpoint is fast while the workflow is wrong.
Where a standard uptime dashboard misses the failure
Think about the support triage agent again.
From the infrastructure lane, the system is healthy. Requests are completing. No alarm fires. The GPU chart looks boring in the best possible way.
From the business lane, the workflow is degrading. The agent is misclassifying tickets with high confidence. It is applying last quarter's refund policy. It is skipping escalation language when a customer mentions legal action. The API did its job. The model did not.
This is why AI observability has to include the artifact the business relies on. For an LLM workflow, the artifact is not only a response time or a 200 status code. It is the answer, the routing decision, the summary, the tool call, the approval request, the record update, and the evidence behind it.
AWS points to a staged path that matches how many teams mature in practice. First they instrument latency, errors, and resource utilization. Then they add sampling and evaluation to catch drift, degradation, and unexpected behavior. Finally they combine infrastructure and quality signals into thresholds and automated alerts.
That sequence is sane. The trap is stopping after stage one because the dashboard looks professional.
Grafana's dashboard docs describe dashboards as panels that create an at-a-glance view of related information from data sources. That phrase is useful. The hard part is deciding what information belongs in the "related" view. If the panel set excludes quality, the dashboard is not wrong. It is blind in the place the business cares about most.
Define "good enough output" before you automate trust
Quality monitoring sounds abstract until you tie it to a specific workflow.
Do not start with "monitor the model." Start with one job the AI system is allowed to do.
For a support triage agent, "good enough" might mean:
- The ticket category matches the internal taxonomy.
- Refund recommendations follow the current policy.
- Enterprise accounts are escalated when the rules say they should be.
- The summary preserves the customer's actual complaint.
- The agent does not update the CRM directly unless a human approves the action.
For a document intake workflow, the checks may be source extraction accuracy, missing-field handling, confidence thresholds, and whether sensitive fields are stored in the right system. That is where AI reliability crosses into data security: the quality lane should include what the model was allowed to access, what it copied, and where the output went.
For an agent that takes action, evaluation should inspect more than the final message. We have argued before that agent evals should test workflow receipts: source data, tool calls, approvals, state changes, and failure recovery. The receipt lets a team reconstruct the decision after the fact.
That is also the line between a helpful demo and a production workflow. A demo can impress with a polished answer. A production system needs an audit trail when the polished answer is wrong.
A first-week scorecard for a production AI workflow
A small team does not need a giant observability program before it ships anything useful. It does need a scorecard that matches the workflow's risk.
Start with one workflow. Pick something narrow enough to review by hand: support triage, invoice exception handling, sales call summarization, policy Q&A, weekly reporting, or document intake. If you are still choosing the first use case, map the work by business value and downside risk before you automate. That is the kind of decision teams should make before browsing AI solutions or production AI services. The principle is simple: do not begin with the flashiest demo. Begin with the workflow you can measure.
Build the first quality lane in a week:
- Choose 20 to 50 real or representative cases.
Use tickets, documents, transcripts, or requests that reflect the messy middle, not only clean examples. Include edge cases: angry customers, missing data, ambiguous policy language, duplicate records, and requests the system should refuse.
- Write pass/fail criteria before scoring.
Define what counts as correct routing, acceptable summarization, compliant policy use, safe refusal, and proper escalation. If reviewers disagree, that is a process problem worth finding early.
- Log the workflow receipt.
Capture the input, retrieved sources, model output, tool calls, approval steps, final state changes, reviewer decision, and any rollback. Do not rely on screenshots or Slack memory.
- Set thresholds for both lanes.
Infrastructure thresholds might cover latency, error rate, request volume, GPU utilization, and cost. Quality thresholds might cover pass rate, policy violations, unresolved low-confidence cases, unsafe responses, and disagreement between evaluator and human reviewer.
If trace-storage pricing is part of that infrastructure budget, use the agent observability cost estimator to normalize one measured day across byte-priced and count-priced plans. Keep the evaluation line separate so a storage estimate does not stand in for output quality.
- Review before allowing direct system updates.
If the AI system can change a customer record, issue a refund, update a financial system, or send an external message, keep a human approval gate until the quality lane has earned trust. For higher-risk workflows, tie the approval and audit pattern back to a broader responsible AI policy rather than leaving it to each project team.
This does not have to be fancy. A spreadsheet, a log table, and a weekly review meeting beat a beautiful dashboard with no judgment in it.
The dashboard is not the operating system
AWS's reference architecture uses SageMaker AI endpoints with inference components, CloudWatch as a centralized metrics store, and Amazon Managed Grafana for combined visibility. That stack makes sense for teams already in AWS. SageMaker endpoints can be invoked and tested through Studio, SDKs, and the CLI, and Studio shows test details such as status, execution length, and request time.
But the broader lesson applies outside SageMaker, Bedrock, or AWS.
If your LLM workflow runs on a hosted model API, a self-hosted model, or an agent framework stitched into internal tools, the same failure mode exists. A technically healthy system can produce low-quality work. A high-quality system can also waste infrastructure if nobody watches capacity and cost. AWS is right to call the two dimensions interdependent.
The dashboard should make that interdependence visible. When quality drops, reviewers should be able to ask whether the model changed, the prompt changed, the retrieval source changed, traffic changed, latency spiked, or the workflow started seeing a new class of cases. When infrastructure cost climbs, teams should be able to ask whether quality improved enough to justify the spend.
That turns AI observability into an operating rhythm: review samples, inspect receipts, adjust thresholds, compare models, roll back bad changes, and decide which workflows deserve more autonomy.
Use observability as a permission system
Do not buy AI observability as more charts.
Buy it, or build it, as a permission system for production AI.
The quantity lane answers: "Can the system keep up, and what does it cost?"
The quality lane answers: "Is the work still good enough to trust?"
Both questions belong on the same scorecard. If either answer is weak, the system should have less permission: more sampling, more approvals, narrower actions, lower automation, or a rollback to the previous prompt, model, or workflow design.
That is the habit production AI teams need after launch. Not dashboard theater. Not benchmark chasing. Not a green wall of charts that ignores the actual work. Better model benchmarks do not guarantee better production outcomes, especially when the failure lives inside a workflow rather than a leaderboard score. We covered that gap in why better benchmarks can produce worse production outcomes.
A clean dashboard can still lie by omission. The fix is not a louder dashboard. It is a quality lane with real cases, real thresholds, and enough authority to slow the system down when the work stops being safe.
Build an AI quality lane
Monitor the decision, not only the endpoint
BaristaLabs helps teams add quality-review lanes, receipt checks, and escalation rules around AI workflows that already have infrastructure monitoring.
Best fit when a workflow is fast and available but nobody can yet prove the output is safe enough to automate.
Turn this idea into a pilot
Which workflow should go first?
Use the readiness check to compare impact, effort, risk, owner, and next step before requesting a review.
- 3-5 minutes
- Deterministic score
- No sensitive data
Practical AI Workflow Notes
Want more practical AI operations ideas?
Get short notes on applying AI inside real small-business workflows — from document handling and customer follow-up to internal reporting, compliance, and automation guardrails.