


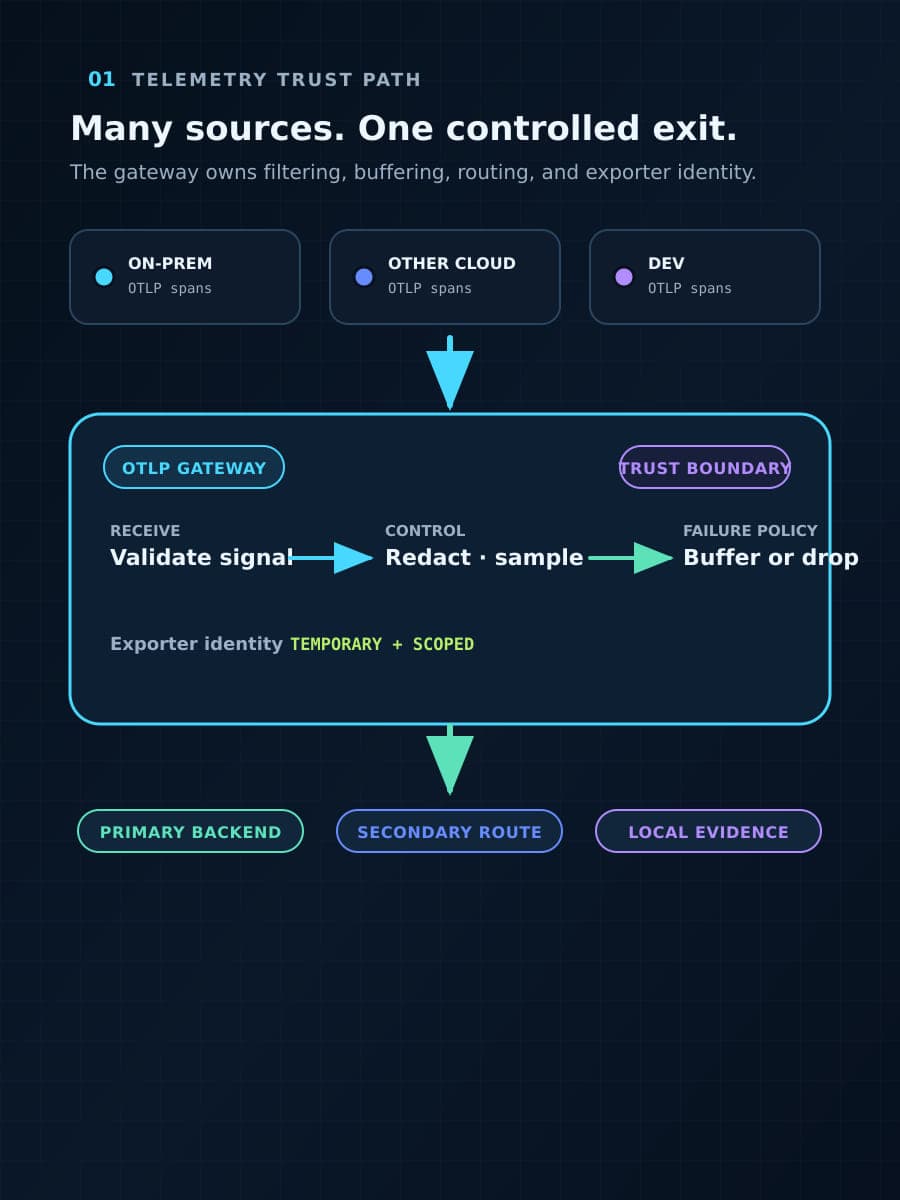
AWS published a walkthrough on August 13, 2026 for sending AI-agent telemetry from on-premises systems, Azure, Google Cloud, and developer machines into Amazon Bedrock AgentCore Observability. The implementation makes a centralized agent dashboard possible without moving the agent itself onto AgentCore Runtime.
The important business decision comes before the dashboard: whether every external workload should export directly to AWS, or whether your organization should first introduce an internal telemetry gateway and temporary-credential boundary. This guide explains the documented path, the operational dependencies it creates, and the tests to run before production traces cross an environment boundary.
What does AWS's cross-cloud path actually do?
AWS's walkthrough runs the AWS Distro for OpenTelemetry, or ADOT, inside the Python agent process. Auto-instrumentation patches the Strands agent framework and boto3, producing OpenTelemetry spans for agent reasoning steps, tool calls, model calls, and token usage.
ADOT then sends telemetry to the Amazon CloudWatch OTLP endpoint. Requests are signed with AWS Signature Version 4, and a log-group header directs data into the location used by the AgentCore Observability dashboard. CloudWatch Transaction Search must be active, and the external environment needs outbound HTTPS access to the relevant AWS endpoints.
That is a direct exporter topology: agent process, AWS-authenticated OTLP request, CloudWatch ingestion, then AgentCore's agent-focused view. AWS demonstrates it with Strands and Bedrock, while naming on-premises, Azure, GCP, and developer environments as possible locations for the workload.
The walkthrough is not evidence that AWS automatically discovers agents across clouds. It is a configuration pattern for instrumented applications that can reach AWS and authenticate there.
Why is identity part of the observability architecture?
The tutorial's setup uses an IAM user access key and secret in environment variables. Its listed permissions cover model invocation plus log, X-Ray, and metric writes. AWS also includes a security note: for production, consider IAM Roles Anywhere instead of long-lived access keys.
Roles Anywhere changes the credential lifecycle, not the need for identity design. An external workload uses an X.509 certificate issued by a trusted certificate authority to obtain temporary AWS credentials. A Roles Anywhere profile can apply a session policy that limits the resulting permissions.
That gives operators a better production question than “where do we store the access key?” Ask which workload identity can write which telemetry, for how long, in which region, and under which session policy. Certificate issuance, renewal, revocation, and trust-anchor conditions also become production dependencies; temporary credentials do not make those responsibilities disappear.
BaristaLabs recommends testing with the narrowest separate telemetry identity that works. Do not reuse an application credential merely because the exporter and model client run in the same process. If the workload does not need to invoke Bedrock, its telemetry path should not inherit bedrock:InvokeModel from the tutorial unchanged.
What can leave the workload with each trace?
Agent traces can be operationally revealing. The AWS post says the instrumentation can capture reasoning steps, tool invocations, model calls, and token usage. Depending on framework settings and attributes, those events may expose prompts, model outputs, tool arguments, record identifiers, URLs, or error details.
OpenTelemetry's semantic conventions make signals easier to describe consistently; they do not decide which business data is appropriate to export. Before enabling auto-instrumentation, inspect a real sanitized trace field by field. Classify each attribute, decide whether to omit, redact, hash, or retain it, and verify that the control runs before data leaves the workload environment.
Also set sampling and retention deliberately. The sources do not provide a workload-independent cost or volume estimate, and a central dashboard does not need every payload from every successful run. Keep the fields and samples required for diagnosis, quality review, security investigation, and audit—not every value the framework happens to emit.
When should you put a Collector gateway in the path?
The OpenTelemetry Collector documentation describes a gateway deployment pattern in which workloads send signals to one OTLP endpoint before that gateway exports to backends. This differs from AWS's in-process, direct-to-CloudWatch walkthrough.
A gateway is worth evaluating when several workloads need one controlled egress point, when platform teams must apply common filtering or routing, or when the business wants the option to send a defined signal set to more than one backend. It can also keep vendor-specific endpoint and signing configuration out of each agent deployment.
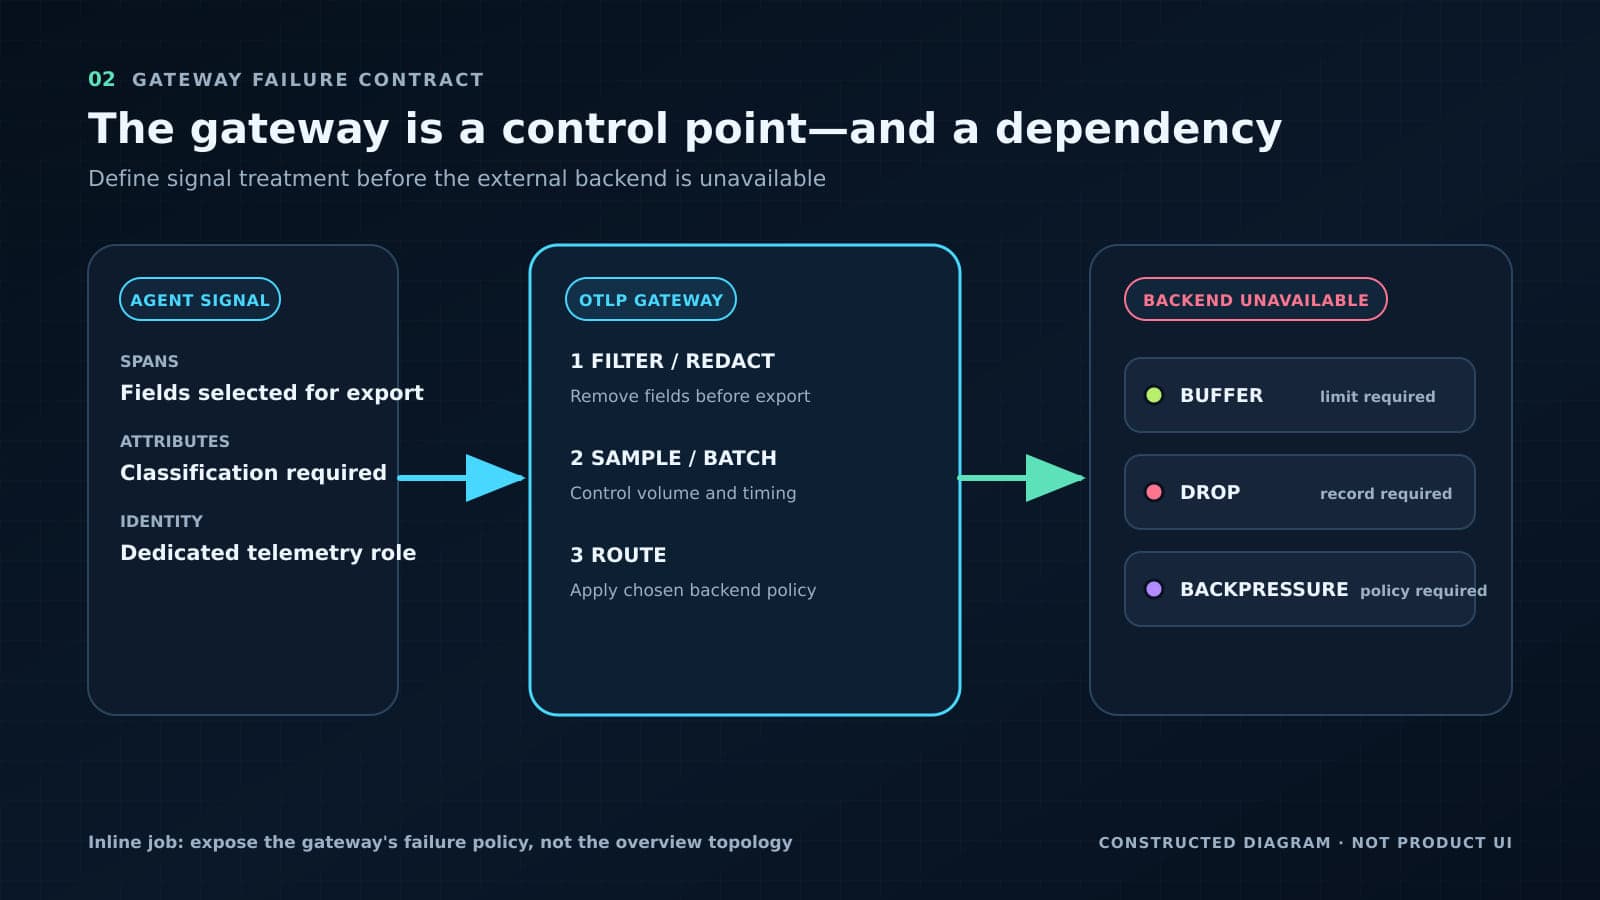
That flexibility has a price. The gateway becomes another service to secure, scale, monitor, and make available. If it cannot accept telemetry, the application needs an explicit policy for buffering, dropping, or applying backpressure. An observability outage should not silently exhaust local disk or stop a customer workflow unless the team chose that behavior.
Do not insert a gateway only to make the diagram look portable. Run it as a measured comparison against the direct exporter path. The useful result is evidence about configuration ownership, credential distribution, failure handling, latency, data filtering, and backend substitution for your workload.
After choosing that topology, run the four-condition gateway failure test against the exact intended path before production traces depend on it.
What should a production pilot prove?
Start with one low-risk agent and a trace schema you can inspect. Run the direct topology or gateway topology you actually intend to operate, rather than validating the dashboard with a developer credential and postponing the identity path.
The pilot should prove these conditions:
- the workload obtains short-lived or otherwise explicitly approved credentials without embedding a long-lived secret;
- its identity can write only the required telemetry to the intended destination;
- sensitive attributes are removed before egress, confirmed from both the exporter side and the rendered backend trace;
- exporter or gateway failure produces the chosen buffer, drop, or backpressure behavior;
- sampling and retention preserve enough evidence for the operator's real investigation;
- a second backend can receive a representative signal set if portability is a stated requirement; and
- the application remains diagnosable when the central observability service is unavailable.
A passing dashboard screenshot is not enough. Review the actual payload, credential lifetime, denied-permission behavior, network path, and failure queue. Then let security, platform, and the workflow owner agree on what the trace may contain and what happens when export fails.
Central visibility should not erase local control
AWS has documented a practical way to bring agent traces from several environments into one AgentCore view. That is useful for teams already operating across cloud and on-premises boundaries, but the dashboard destination should not silently choose the workload's identity, data, or failure policy.
Choose the telemetry topology as part of production architecture. If your team is evaluating AgentCore Observability for agents outside AWS, ask BaristaLabs to review one telemetry path before production traces begin crossing that boundary.
Sources
- AWS Machine Learning Blog: “Monitor on-premises and multi-cloud AI agents with AgentCore Observability”, August 13, 2026.
- AWS IAM Roles Anywhere User Guide: “What is AWS Identity and Access Management Roles Anywhere?”, accessed August 16, 2026.
- OpenTelemetry: “Deploy the Collector”, last modified January 29, 2026.
Agent observability architecture review
Review one agent telemetry path before production
BaristaLabs can map one workload from instrumentation through credentials, egress, collection, redaction, storage, and operator access.
Use a sanitized event schema and deployment diagram; no production traces or credentials are needed.
Turn this idea into a pilot
Which workflow should go first?
Use the readiness check to compare impact, effort, risk, owner, and next step before requesting a review.
- 3-5 minutes
- Deterministic score
- No sensitive data
Practical AI Workflow Notes
Want more practical AI operations ideas?
Get short notes on applying AI inside real small-business workflows — from document handling and customer follow-up to internal reporting, compliance, and automation guardrails.