


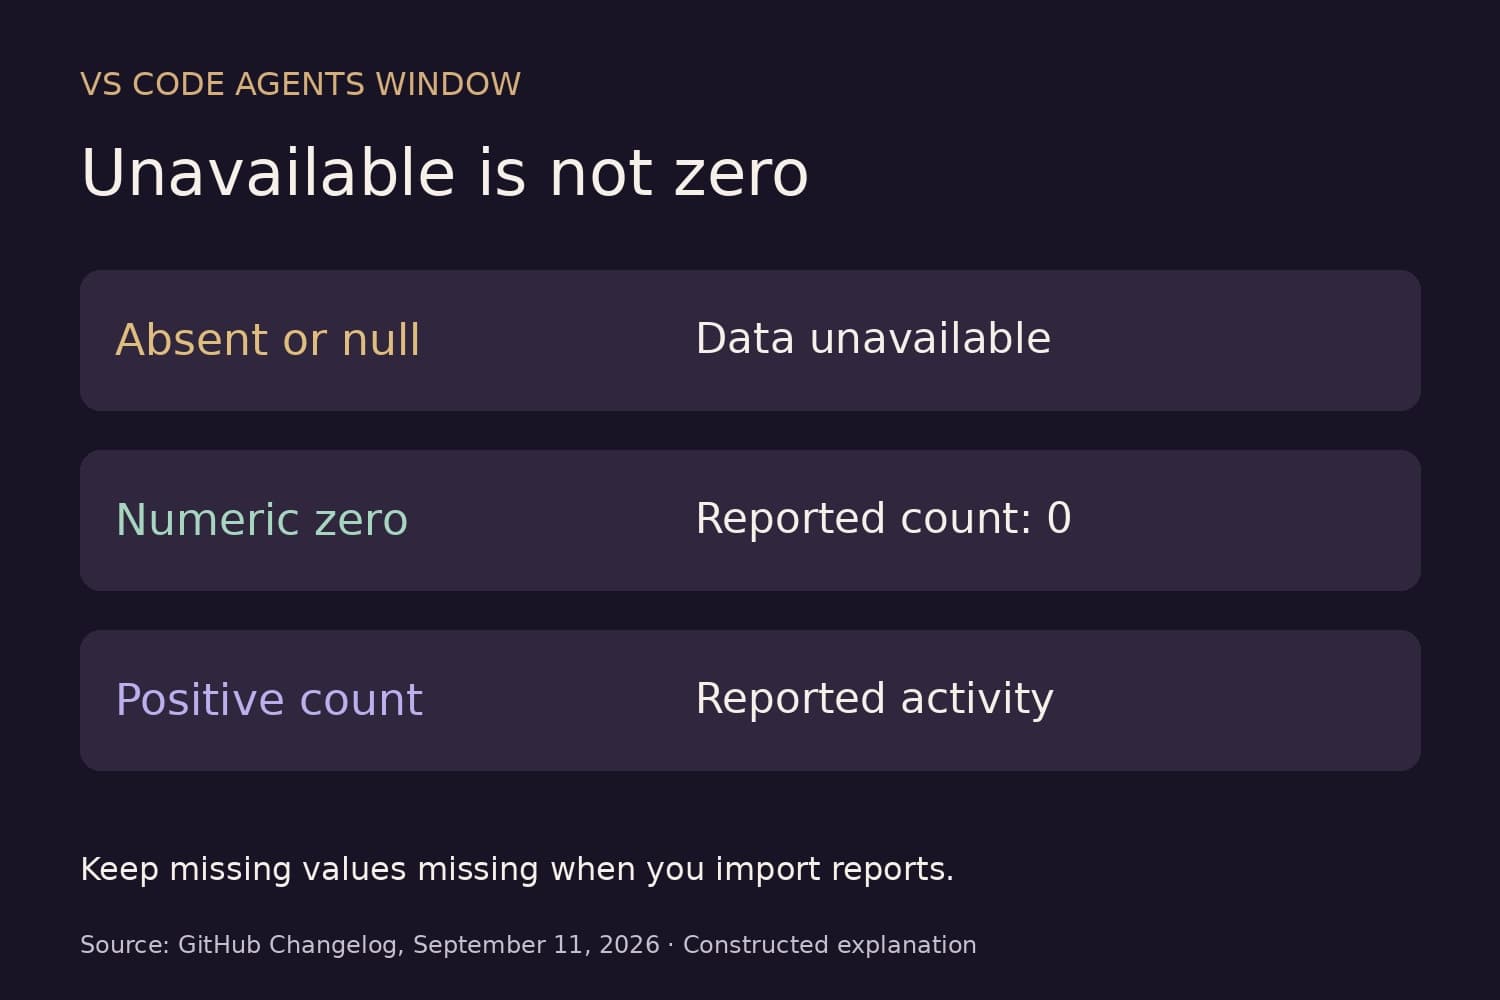
GitHub added generally available usage metrics for the dedicated VS Code Agents window on September 11. Teams that export Copilot reports can now track daily active users, sessions, and user messages for that window. Before adding the fields to a dashboard, check how your importer handles missing values: GitHub says an absent or null field means the corresponding data is unavailable.
That matters because a common reporting shortcut replaces missing counts with zero. For these fields, that would turn “we do not have the data” into “no activity was reported.” A team could appear inactive because its report lacks data, rather than because nobody used the window.
What the new fields report
The GitHub announcement describes additions to both one-day and 28-day reports. At the enterprise and organization level, daily_active_vscode_agent_users is an optional count of unique users active in the dedicated window each day. The optional totals_by_vscode_agent object contains session_count and total_user_messages.
Enterprise-user and organization-user reports add an optional used_vscode_agent indicator, along with per-user session and message totals in totals_by_vscode_agent. These let an analyst distinguish an aggregate activity count from an individual user's reported use. Keep that distinction in column names and report labels.
The daily active-user field remains a daily measure even when it arrives in a 28-day report. Adding daily counts does not produce a count of unique people across the whole period: the same person can be active on several days.
Preserve missing values through the whole import
GitHub explicitly says that optional fields remain absent or null when the corresponding Agents-window data is unavailable. Our recommendation is to preserve that state from ingestion through display, rather than fixing it only in the final chart.
For a count field, handle an absent key or null as unavailable. Keep an explicitly reported numeric zero as zero, and keep a positive count as the reported value. Reject unexpected types through your normal validation path instead of silently converting them to numbers. For the user-level indicator, preserve an explicit false; it is different from a missing indicator.
In a database, that may mean a nullable numeric column plus enough retained source data to investigate the import. In a dashboard, show “Unavailable” or a gap for missing data and reserve “0” for a reported zero. If a summary combines records with and without data, identify its coverage instead of presenting the partial total as complete.
This is also a useful place for a small regression test. Test an absent field, an explicit null, an explicit zero, and a valid positive count. Test missing and false user-level indicators separately. These are importer test cases, not examples of observed GitHub account activity.
Keep the dedicated window separate from Agent Mode
The new metrics cover the dedicated VS Code Agents window only. GitHub says they remain separate from editor-window Agent Mode and generic usage rollups. A dashboard label such as “All VS Code agent activity” would therefore describe more than these fields measure.
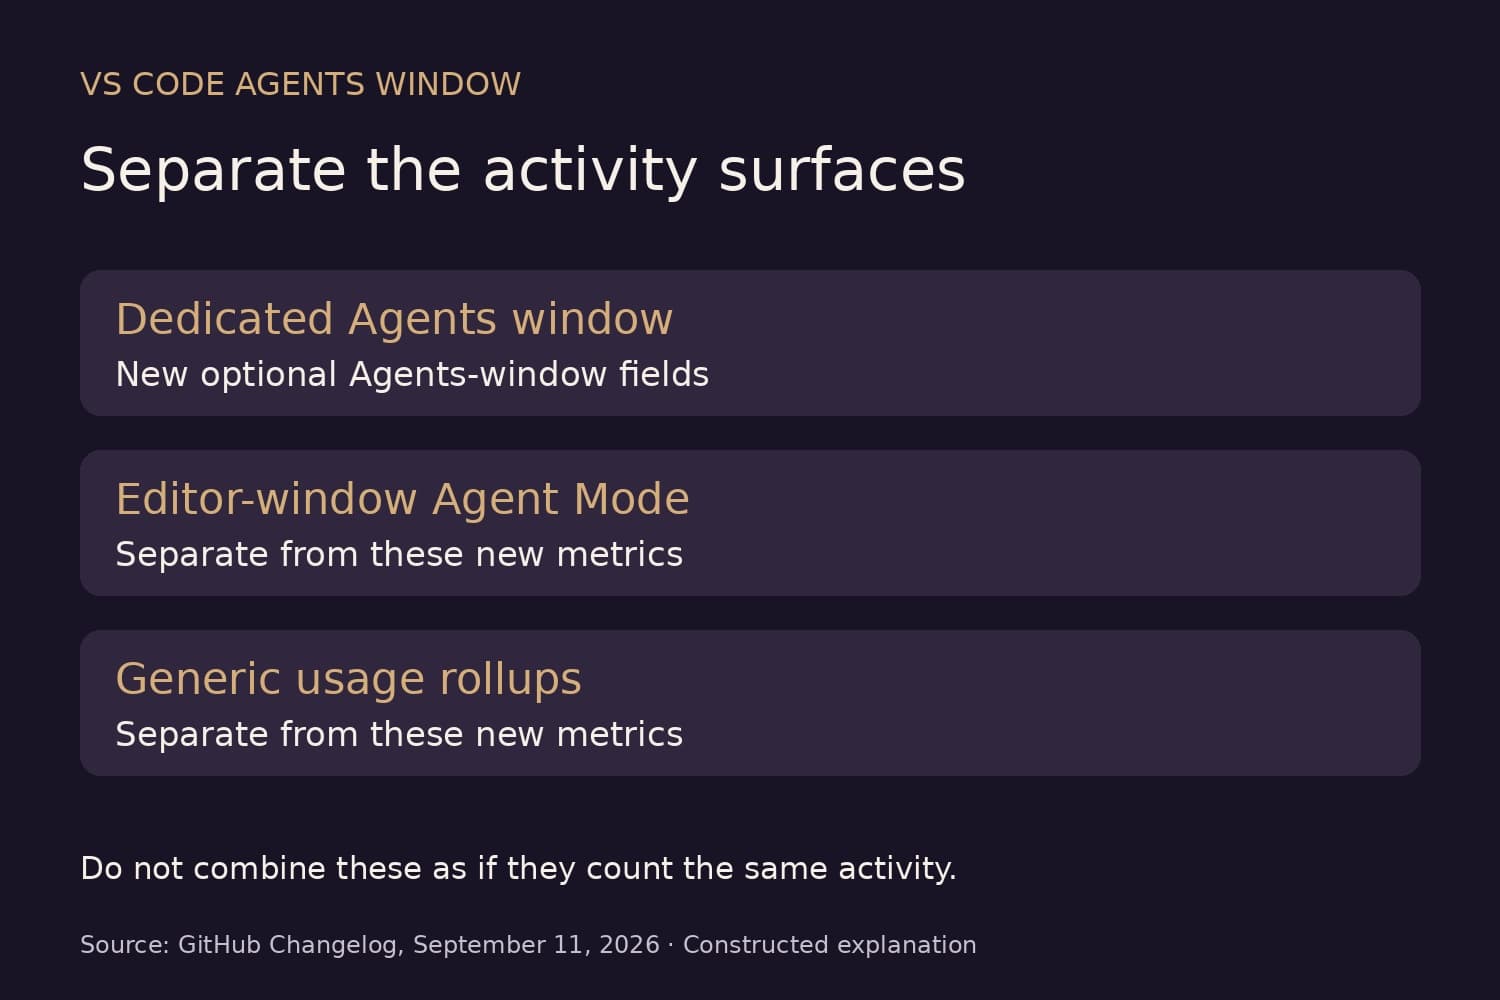
Use a label such as “VS Code Agents-window sessions” for session_count from this object. Keep any existing Agent Mode series under its own definition. Do not append the new values to a different activity series merely because both names contain “agent.”
This differs from the earlier Copilot app metrics definition change, which expanded existing rollups. Here, the documented change adds separate window-specific fields. The immediate engineering task is to ingest those fields without losing their availability state or their scope.
Check access before diagnosing a blank report
Access requires an eligible role and an enabled Copilot usage metrics policy. GitHub lists enterprise owners and billing managers, organization owners, and custom organization or enterprise roles with the View Copilot Metrics permission. Administrators can start with the linked Copilot usage metrics API documentation.
Those requirements are worth checking, but an unavailable field alone does not identify the cause. The announcement does not establish why a particular organization's data is missing, nor does it promise historical backfill. Keep the raw report and the report period when investigating instead of assigning a cause from the chart.
Before shipping the dashboard update, trace one unavailable value and one reported zero from the source report to the screen. They should still look different at the end. That simple check is more useful than a polished adoption chart built on values your importer invented.
Reporting integration help
Keep missing data out of your activity totals
BaristaLabs can help review the import logic and dashboard labels in your reporting workflow. Start with the fields that currently turn missing values into zero.
Share a redacted field mapping or a description of the report you need to fix.
Practical AI Workflow Notes
Want more practical AI operations ideas?
Get short notes on applying AI inside real small-business workflows — from document handling and customer follow-up to internal reporting, compliance, and automation guardrails.