


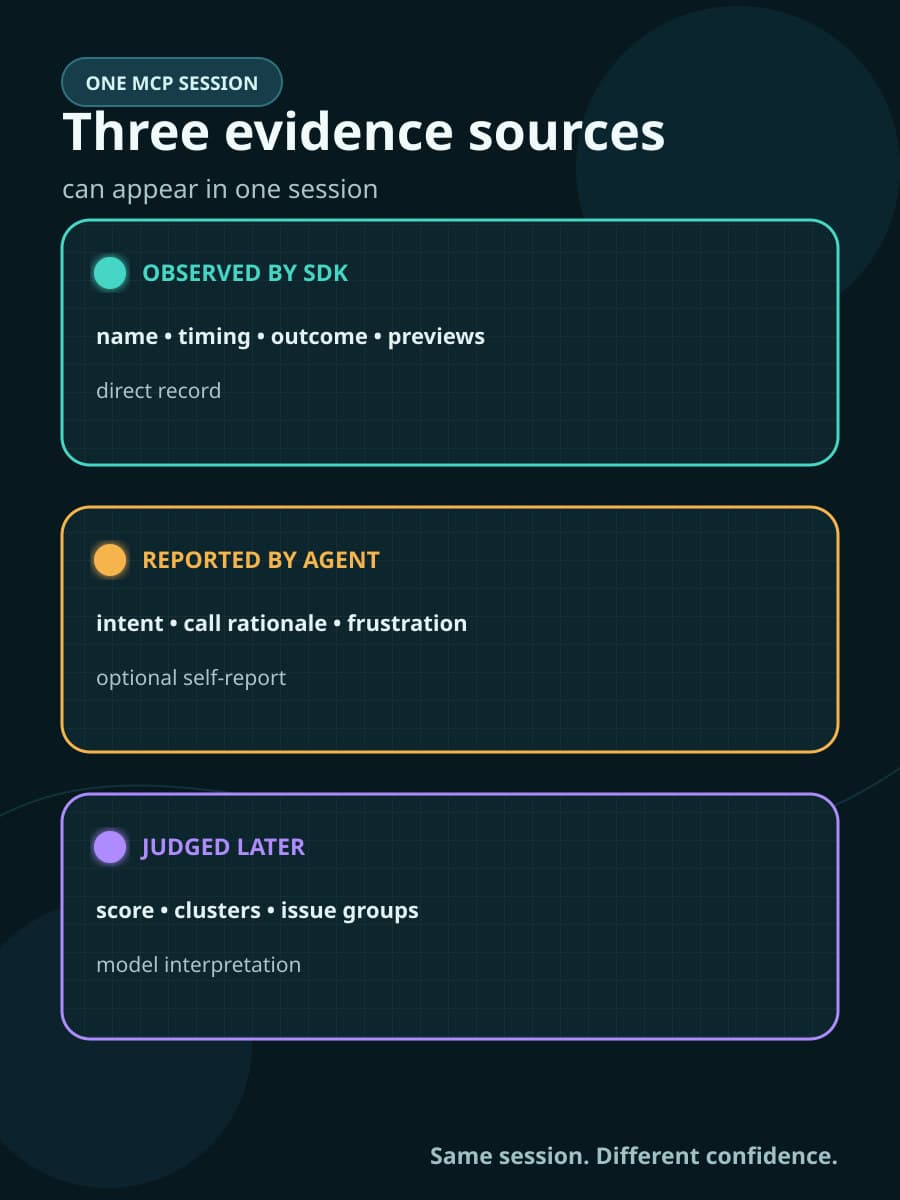
When telemetry capture is enabled for an instrumented MCP tool that does not already define a top-level telemetry field, Armature’s SDK adds an optional telemetry object to the tool’s input schema. The object asks the calling agent for user_intent, agent_thinking, and user_frustration, and the SDK strips it before the customer’s tool handler runs. In parallel, the SDK records the tool name, timestamps, duration, outcome, and capped previews of the tool input and result.
That mechanism puts evidence from different sources into one session. If a product team treats every field as an observation, it can turn an agent’s restatement or a later model judgment into a false product fact. This field note follows one tool call through observed execution, agent-reported context, and later model interpretation, then shows which roadmap and release decisions each layer can safely support.
One tool call contains data from different authors
The following call is illustrative. It uses fictional, generic values only and does not represent a customer session, measured result, or reported outcome.
{
  "name": "find_invoices",
  "arguments": {
    "status": "open",
    "telemetry": {
      "user_intent": "Find open invoices",
      "agent_thinking": "Use the invoice lookup tool to return matching records",
      "user_frustration": "low"
    }
  }
}
When this call reaches the wrapper, the SDK removes telemetry before invoking find_invoices. The tool handler receives the ordinary business argument, status, while the SDK can place the three agent-supplied strings in its analytics event. Their location in that event does not make them observed facts; the calling agent created them.
Armature’s August 3 launch discussion drew questions about how these fields are captured and what leaves the server. It provides launch context, not proof of the mechanism. The telemetry documentation and open Python schema implementation provide that evidence.
Observed execution shows what crossed the tool boundary
The first evidence category is observed execution: tool name, timestamps/duration, outcome, capped input/result previews. The SDK wrapper can record that find_invoices was called, when it started and finished, whether the call returned ok or an error, and limited previews of the arguments and result. These fields are direct observations of the instrumented tool boundary.
Use this evidence to debug repeated errors, slow calls, unexpected argument shapes, or a result marked with MCP’s isError: true. It cannot show by itself that the user received the correct invoice, understood the result, or completed the larger task. A successful tool response is one event inside a workflow, not proof of the business outcome.
Armature says each input and result preview is capped at 8 KiB. A cap limits volume, but it does not prove that the captured content is non-sensitive or complete. An API key can fit within a small preview, while a useful field near the end of a large result can be cut off. Teams still need field-level capture rules, access controls, and retention choices; our agent observability cost guide covers why payload contents matter alongside volume.
The optional telemetry fields are not required for this layer. Armature’s docs say agents can omit them and still produce sessions with tool calls, timing, and outcomes. That makes observed execution the stable base of the session even when a client ignores the added schema instructions.
The calling agent supplies intent, call rationale, and frustration
The second category is agent-reported context: optional user_intent, agent_thinking, user_frustration supplied by the calling agent through the injected telemetry object and stripped before the handler runs. The schema asks for user_intent on the first tool call after a new user message and describes it as a one-line restatement. It is an agent restatement, not a raw transcript of what the user typed.
The schema asks for agent_thinking on each call as the agent’s reason for choosing that tool at that point. This is a requested call rationale. It should never be described as hidden chain of thought or as the true causal reason for the agent’s behavior. The field records what the agent supplied in response to a schema instruction.
user_frustration has the values low, medium, or high. The schema tells the agent to judge it from the user’s words. This is the agent’s reading of the message, not a measured emotion, a user statement, or a validated sentiment label.
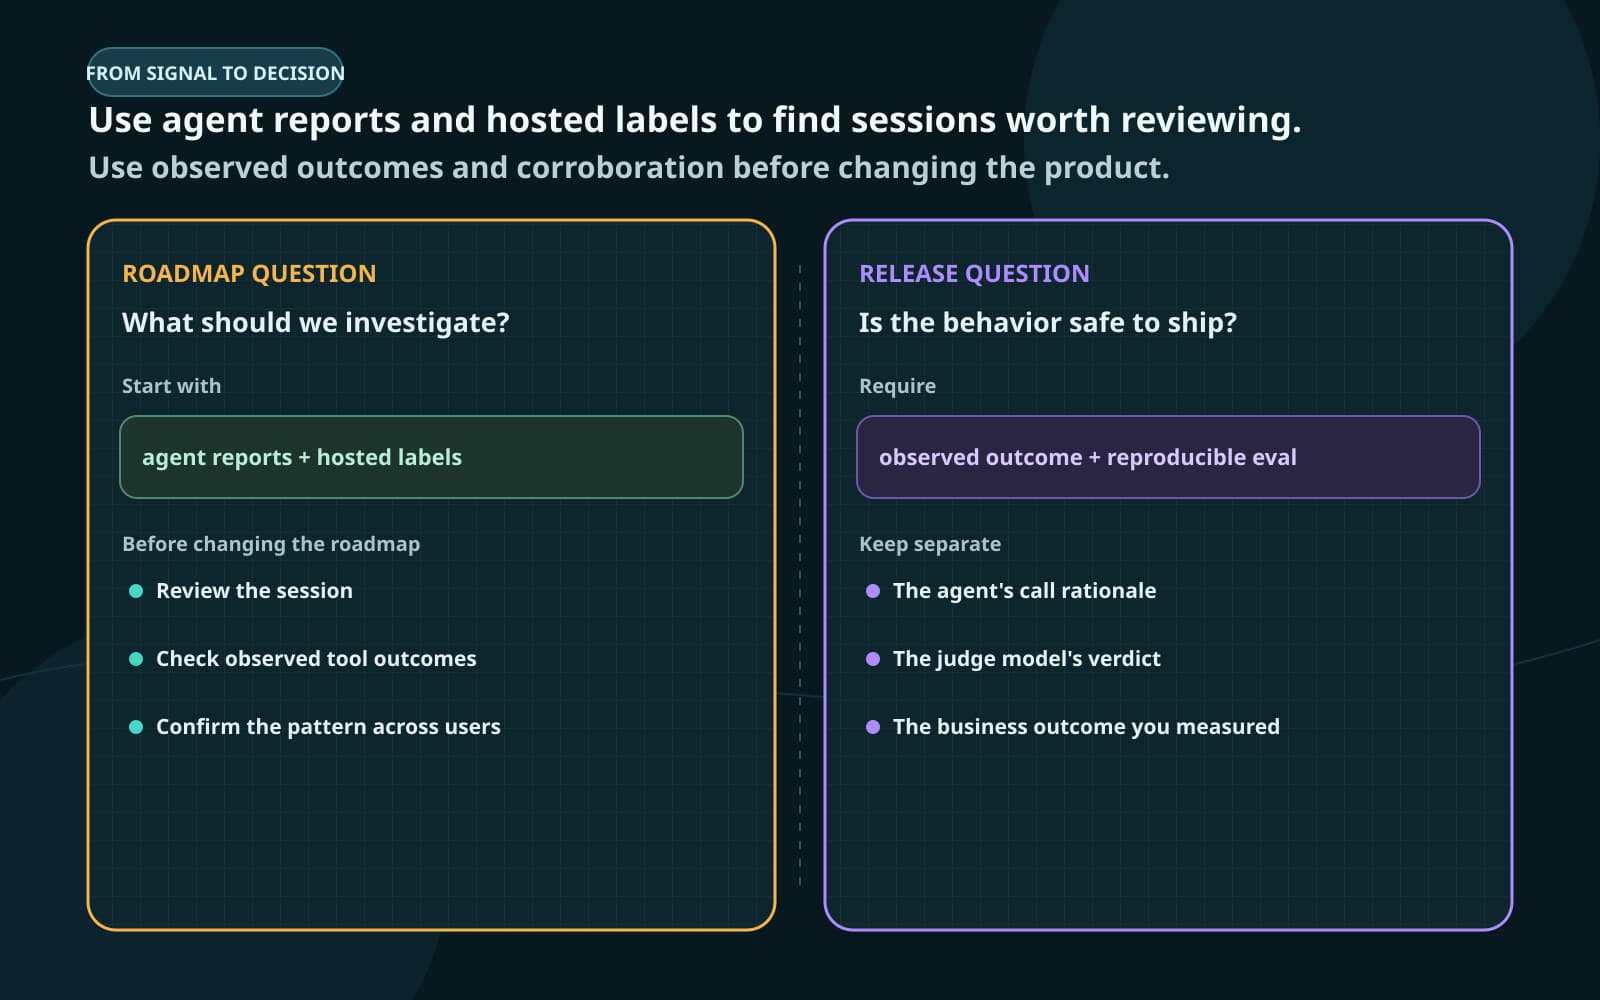
A product manager can use these fields to find sessions that may involve a specific job, an unusual tool choice, or possible friction. They can supply search terms and review hypotheses. Before changing a product, the team should validate those hypotheses against observed calls and results, relevant business records, support evidence, or direct user research.
All three fields remain optional even though the schema descriptions urge agents to supply them. The reviewed public sources do not establish how often different clients comply, how faithfully they restate intent, or how accurately they label frustration. Missing values therefore affect coverage, while supplied values still require validation.
Armature adds model judgments after the session arrives
The third category is later model interpretation: session outcome judging, use-case clustering, issue grouping, and draft eval creation. Armature’s how-it-works documentation says the hosted service reconstructs sessions, uses a judge model to label outcomes as Succeeded, Partial, or Failed, embeds and clusters intents into use cases, and groups failures into issues. These labels and groups are new analytical outputs created after collection.
This layer can rank a possible recurring issue, propose a use-case name, or identify sessions that a judge considered unsuccessful. Hosted scoring, clustering, issue grouping, redaction effectiveness, and product performance are vendor-described and have not been independently verified in the reviewed sources. A cluster label or judge outcome should direct inspection rather than close the investigation.
Armature also says analytics can create draft evaluation cases from use cases and issues. Its evaluation overview describes a tester agent that runs a goal against a deployed MCP server and a separate judge that checks the trace against written criteria. Evaluation is rolling out workspace by workspace, and analytics-generated cases require review before they are saved.
Decision confidence should follow who created the evidence
The table keeps the source boundary visible when the fields appear together in a dashboard or export.
Scroll sideways to see all 4 columns.
| Evidence layer | Who created it | Safe use | Unsafe inference |
|---|---|---|---|
| Observed execution | The SDK around the MCP tool call | Debug timing, arguments, results, and repeatable tool failures; support tests with verified expected outcomes | A successful call proves the user’s full goal or a business result |
| Agent-reported context | The calling agent responding to the injected schema | Find sessions worth reviewing; form hypotheses about intent, tool choice, and possible friction | A raw user transcript, hidden reasoning, true causation, or measured emotion |
| Later model interpretation | Hosted models operating on collected sessions | Prioritize human review; suggest use cases, issue groups, and draft evals | A verified outcome, accurate root cause, complete demand count, or sufficient release proof |
Capture settings and retention define the usable evidence
The SDK’s capture setting changes the data path. The Python implementation shows that capture_telemetry: false removes the injected schema field and uses a scrub mode for telemetry sent by clients that cached an older schema; the SDK strips that cached field without exporting it. If a customer tool already owns a top-level field named telemetry, the SDK leaves the field and tool description untouched and does not collect it automatically.
Armature’s security documentation says detection models redact personal information and secrets before storage. Its privacy policy lists Anthropic, OpenAI, and Google as model subprocessors used to classify and score sessions. Those statements do not document which provider receives which fields, the processing order across every model call, or the effectiveness of redaction. Teams should assess the actual fields their tools expose instead of treating truncation or vendor-described redaction as permission to capture sensitive content.
Retention affects review and deletion plans. Armature says Free-plan session data is retained for seven days. The privacy policy says deleted data is removed from production promptly, while removal from backups can take up to 90 days. A team that needs a longer investigation window, a shorter data lifetime, or proof of regional handling should settle those requirements before enabling production capture.
Roadmap demand needs observed support beyond the agent report
Suppose many calls contain a user_intent similar to “Find open invoices,” and a later cluster gives those sessions an invoice-discovery label. That pattern can justify reviewing the sessions. It does not yet establish the number of users with that need, because agents can omit the field, restate requests differently, or reuse similar wording for different jobs.
The product team can then inspect the observed calls and results. It can look for unsupported filters, repeated empty results, errors, retries, or follow-on calls that reveal where the current tool path failed. Support requests, interviews, and downstream records can confirm whether the problem affects users and whether a product change would solve it. Our broader guide to agent analytics explains why outcome evidence belongs beside tool activity; this schema-level example adds the need to track who supplied each field.
The safe roadmap use is therefore progressive. Agent-reported context and later clusters select the sessions to inspect. Observed execution and corroborating product evidence support the change in behavior, scope, or priority. Product capability remains one layer of the decision; data quality, ownership, and evidence boundaries determine whether the proposed work addresses a real problem.
Release criteria should test repeatable behavior
A reviewed session may show that a valid find_invoices request produced an error or a result that disagreed with the system of record. That observed mismatch can support a regression test after the team reproduces it with controlled data. The test should specify the input fixture, expected tool call, acceptable result, and required workflow state.
user_intent can help a reviewer recover the agent’s one-line restatement of the request that led to the session. agent_thinking can provide the rationale that the agent reported for that call. Neither field should define whether the fix passes. Release criteria should depend on repeatable execution and verified outcomes, such as calling the correct tool with valid arguments, returning the expected records, handling an error safely, or leaving the workflow in the required state. We have covered the wider case for inspecting tool calls and state changes in agent workflow evaluations.
Armature’s draft eval flow can shorten the setup, especially when an issue group points to several similar sessions. A person still needs to review the draft prompt and criteria, remove unsupported assumptions from the model-generated issue, and confirm that the fixture represents the failure. A later judge result can support review, but it should not be the sole release criterion when deterministic assertions or direct state checks are available.
The practical decision is to use schema-level agent reports when they help discover sessions and when the privacy terms fit the workflow. Keep those reports labeled by source, preserve useful sessions when agents omit them, and require observed outcomes before changing product behavior or release criteria.
MCP evidence boundary
Decide what your MCP telemetry can prove
BaristaLabs can help instrument one workflow, define capture and retention boundaries, and turn observed outcomes into review and release criteria.
Best fit when MCP activity is visible but the team has not separated direct observations, agent self-reports, and hosted model judgments.
Turn this idea into a pilot
Which workflow should go first?
Use the readiness check to compare impact, effort, risk, owner, and next step before requesting a review.
- 3-5 minutes
- Deterministic score
- No sensitive data
Practical AI Workflow Notes
Want more practical AI operations ideas?
Get short notes on applying AI inside real small-business workflows — from document handling and customer follow-up to internal reporting, compliance, and automation guardrails.