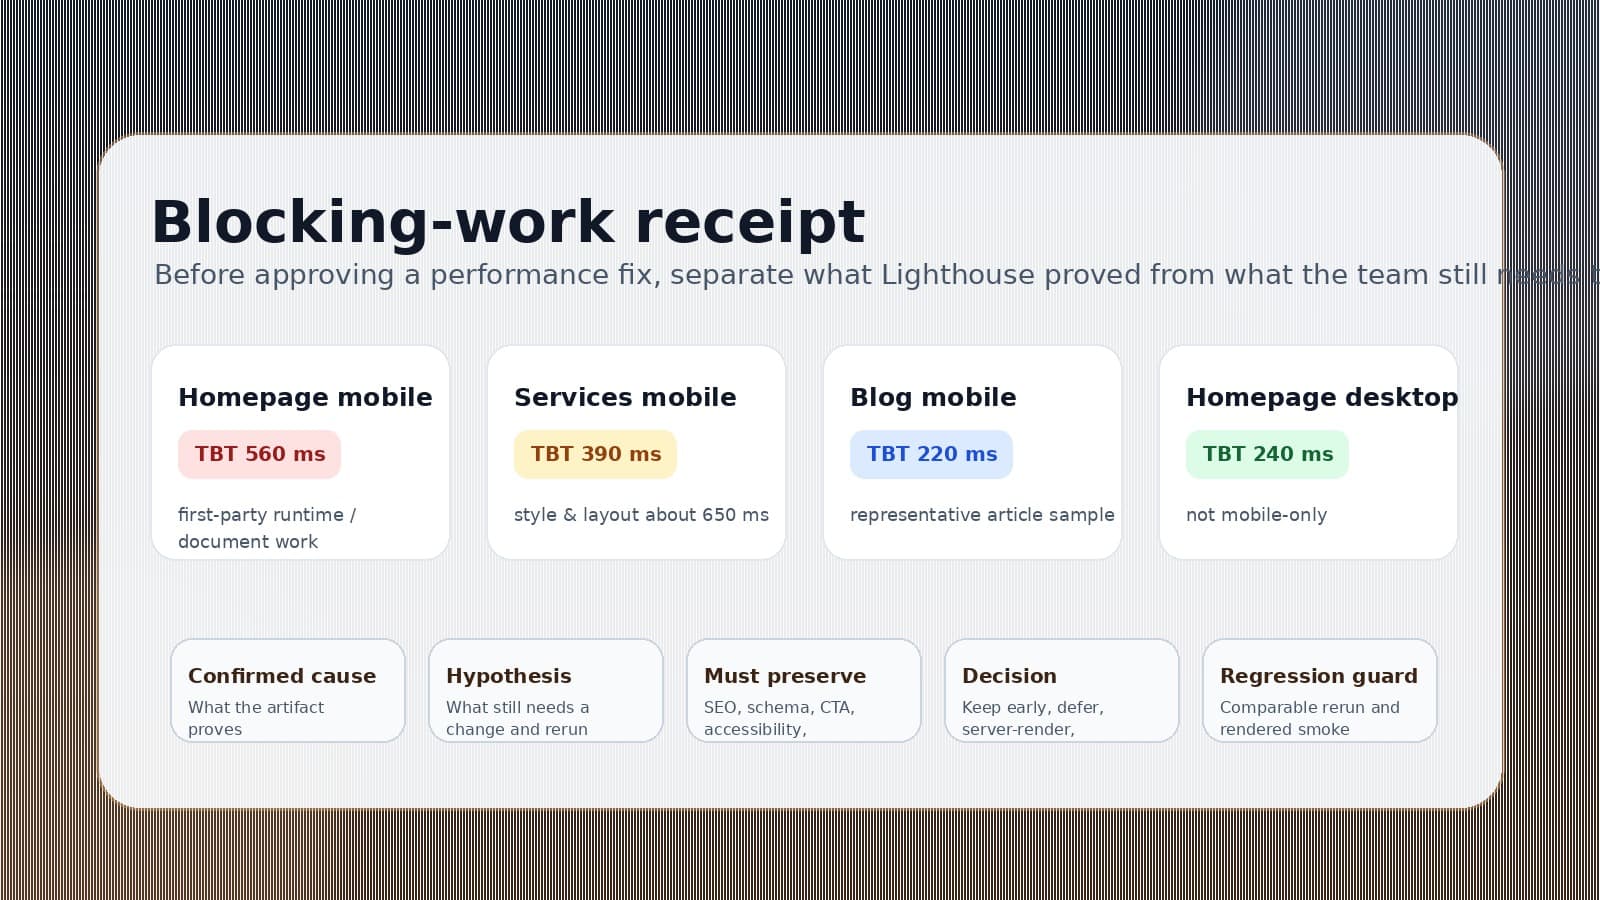


Three mobile Lighthouse runs put an operator in an uncomfortable position. The homepage scored 76, 80, and 62 for Performance. Total Blocking Time came back at 1,084.5 ms, 714.5 ms, and 5,110.5 ms.
The page still worked. The lab series still demanded investigation. But did it justify changing production code?
The answer came from a blocking-work receipt: repeated measurements, recorded runner conditions, trace attribution, preservation rules, and a decision. Five controlled production samples did not reproduce the alarming series. Their Performance median and p75 were both 98; TBT was 61/63 ms; LCP was 2,266.5/2,280 ms; CLS was 0. An independent local production cohort and a final accepted production cohort also stayed within the investigation's budgets.
No application source changed. That was the technically correct outcome.
A blocking-work receipt helps a team reach one of three decisions: fix a demonstrated problem, measure again when the evidence is incomplete, or make no change when a speculative edit would add more risk than value.
TBT can open an investigation without closing it
Chrome defines Total Blocking Time as the sum of the blocking portion of long tasks between First Contentful Paint and Time to Interactive. A task longer than 50 ms counts as a long task; only the time after the first 50 ms contributes to TBT.
That makes TBT useful for finding synthetic startup pressure. A page can be visible while JavaScript, document parsing, style, layout, or other main-thread work keeps the browser busy.
TBT is not field Interaction to Next Paint. INP measures the latency of real user interactions over a page visit. A Lighthouse TBT series can identify work worth profiling, but it cannot establish the route's field INP or prove a user-experience outcome.
The first three homepage runs were therefore raw task facts, not a diagnosis. They established a reason to investigate. They did not establish a source owner, a commit cause, or permission to cut production behavior.
The controlled cohort changed the decision
The investigation kept accepted samples on comparable deployments and mobile settings, recorded Lighthouse and Chrome versions, ran sequentially, and watched the host. The quiet same-deployment production baseline returned this five-sample summary:
Scroll sideways to see all 3 columns.
| Metric | Median | p75 |
|---|---|---|
| Performance | 98 | 98 |
| TBT | 61 ms | 63 ms |
| LCP | 2,266.5 ms | 2,280 ms |
| CLS | 0 | 0 |
A separate five-run local production build returned TBT of 192.9/229.1 ms and LCP of 1,799.8/1,839.9 ms at median/p75, with CLS 0. The final five accepted production samples returned TBT of 139/153 ms and LCP of 1,962.1/2,264.2 ms, with CLS 0.
Three additional final-verification runs were excluded because documented host work made them contended. They remain in the evidence archive. The exclusion rule was about test conditions, not whether a number looked inconvenient.
BaristaLabs interpreted the combined evidence narrowly: the initial high-TBT series did not reproduce under controlled conditions, and no homepage-only regression or recent-commit cause was verified. This does not mean every high Lighthouse result is noise. It does not make five runs a universal sample size. The right cohort depends on the decision, expected variance, deployment stability, runner calibration, route controls, and access to field data.
The recommendation followed the evidence: keep the application source unchanged, retain the traces, and define the conditions that would reopen implementation work.
Profiling still produced useful clues
No-change does not mean no learning.
Trace profiling found that a shared Next.js App Router chunk created the largest recurring JavaScript long task on both the homepage and the Process Automation page. Homepage document and layout work added a secondary cost. The profile did not find webpack bootstrap or third-party scripts to be material initial-load blockers in those runs.
Those are measurable clues. They are not proof that the framework caused a regression or that removing a homepage section would improve the decision metric. The homepage and comparison route shipped the same initial JavaScript assets, and the investigation had no before-and-after trace tied to a specific commit.
That distinction protects the page from a familiar failure mode: Lighthouse names a chunk, the team treats the filename as a root cause, and an implementation removes useful content or behavior without correcting a demonstrated defect.
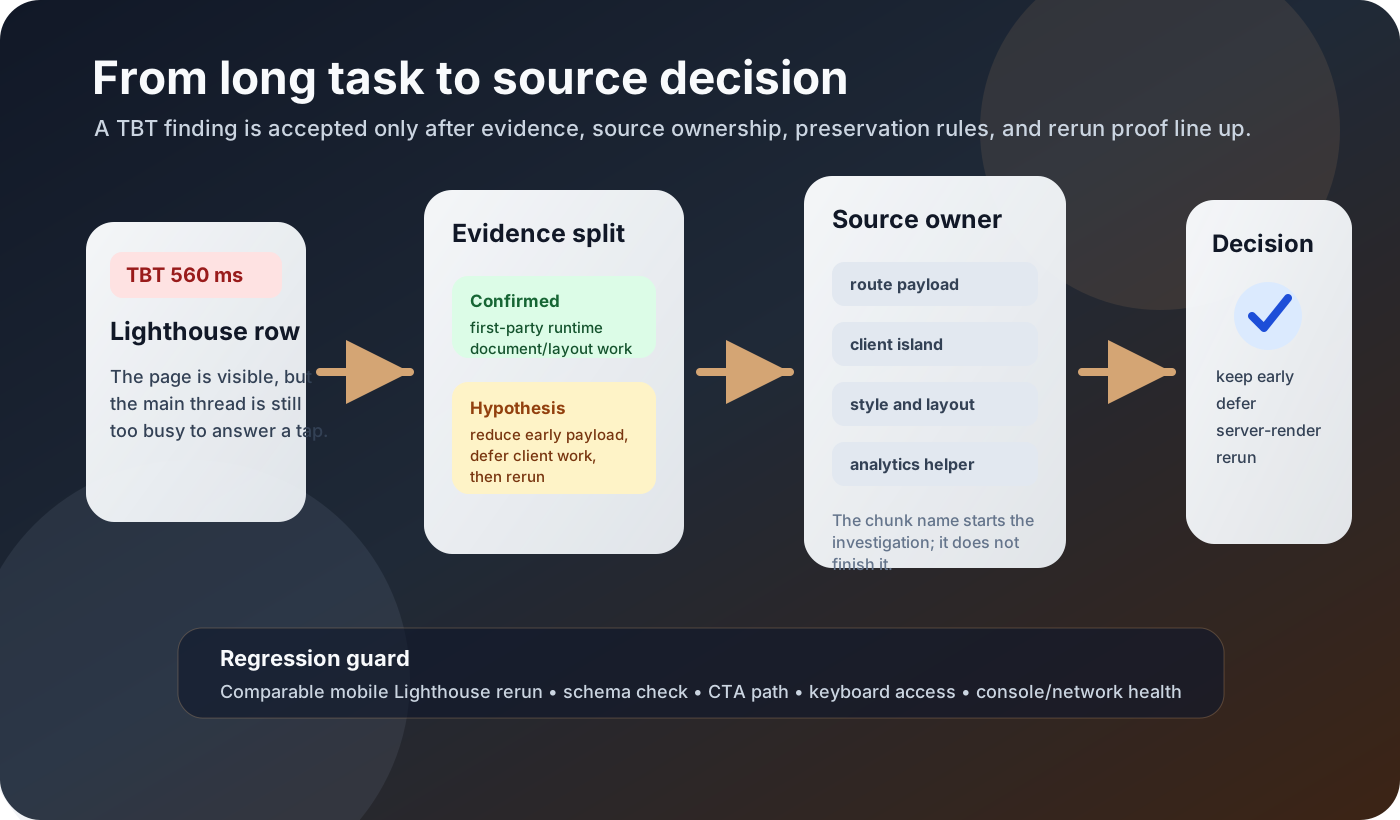
The blocking-work receipt
A blocking-work receipt is a compact record a reviewer can read before approving a change or a no-change decision.
Performance receipt
Blocking-work receipt
One Lighthouse finding becomes a small proof record before anyone changes the page.
- Route and context: URL, page type, origin, viewport, device profile, Lighthouse version or command, date, and deploy or commit when available.
- Metric and target: TBT value, performance score, target threshold, and mobile or desktop run type.
- Nearby user risk: The tap, click, keyboard action, search open, CTA, navigation, or form start that might wait.
- Long-task owner: Attributed URL, chunk, document task, style/layout bucket, third-party row, or unattributable task.
- Confirmed cause: What the artifact proves: first-party runtime, document payload, style/layout, third-party script, image/video work, or unknown.
- Hypothesis: The likely source-level reason that still needs implementation and measurement.
- Code or content area: Component, route, script, template, service section, CTA module, analytics helper, schema, or content payload.
- Must preserve: SEO text, schema, H1/H2 outline, CTA path, accessibility, analytics attributes, search affordance, and conversion-critical behavior.
- Decision: Fix, measure again, or make no change; if fixing, keep early, server-render, defer, intent-load, simplify layout, move below fold, or remove.
- Regression guard: Comparable Lighthouse cohort, build/test/lint, rendered mobile smoke, schema check, console/network check, and click/keyboard check.
Test: can a reviewer tell what the browser was doing, what the team changed, and how the page stayed intact?
The receipt should distinguish three layers:
- Raw task facts: the actual samples, traces, warnings, deployment IDs, exclusions, and checks.
- Interpretation: what the evidence supports and what remains unresolved.
- Recommendation: fix, measure again, or make no change, with an owner and reopen condition.
That separation matters when an AI agent is asked to “fix Lighthouse.” Agents act well on confident instructions. A receipt prevents confidence from hiding an unsupported premise.
When to fix, measure again, or make no change
Fix when comparable evidence reproduces the problem, attribution gives the implementation owner a testable source area, and the receipt names what the change must preserve. A useful fix changes one defensible mechanism and returns with before-and-after evidence.
Measure again when deployment drift, runner contention, warnings, route differences, or wide variance make the comparison unreliable. Keep rejected samples with their reasons. Add a shared-route control or field data when it can answer a question the lab cannot.
Make no change when controlled evidence does not reproduce the problem and the proposed edit would be speculative. Record that decision as carefully as a patch. In this case, the team set concrete reopen conditions: a normally calibrated same-deployment mobile cohort whose p75 exceeds 300 ms TBT or 2.5 seconds LCP, CLS above 0.1, or route- and device-segmented field INP evidence of a real interaction problem.
Those thresholds belonged to this investigation; they are not universal Lighthouse law.
Keep the decision with the page
A green score is not the receipt. Neither is a dramatic red run.
Keep the route, cohort, conditions, source clues, preservation rules, decision, and verification together. Then the next reviewer can see why the team changed the page, why it measured again, or why it left production alone.
BaristaLabs helps teams turn performance findings into reviewable implementation packets: evidence, source ownership, preservation rules, and verification before a production edit earns approval.
Bring one route and the Lighthouse evidence that raised the question. The first useful outcome is knowing whether the page needs a fix, another cohort, or no change at all.
Implementation help
Turn one slow page into a fix packet
BaristaLabs helps small teams turn Lighthouse findings into evidence-backed implementation packets: source-owner decisions, preservation rules, and verification checks before the next deploy.
Bring one route, one Lighthouse run, and the business behavior the page must keep.
Turn this idea into a pilot
Which workflow should go first?
Use the readiness check to compare impact, effort, risk, owner, and next step before requesting a review.
- 3-5 minutes
- Deterministic score
- No sensitive data
Practical AI Workflow Notes
Want more practical AI operations ideas?
Get short notes on applying AI inside real small-business workflows — from document handling and customer follow-up to internal reporting, compliance, and automation guardrails.